Easily create comprehensive, interactive data visualisations from multiple data sources and share important business analyses. Collaborate with colleagues and enable everyone to make informed, data-driven decisions quickly.

Data connection
Power BI allows you to connect to a variety of data sources, including databases, local files, cloud services and more. It can extract and combine data from different sources to create a single visualisation
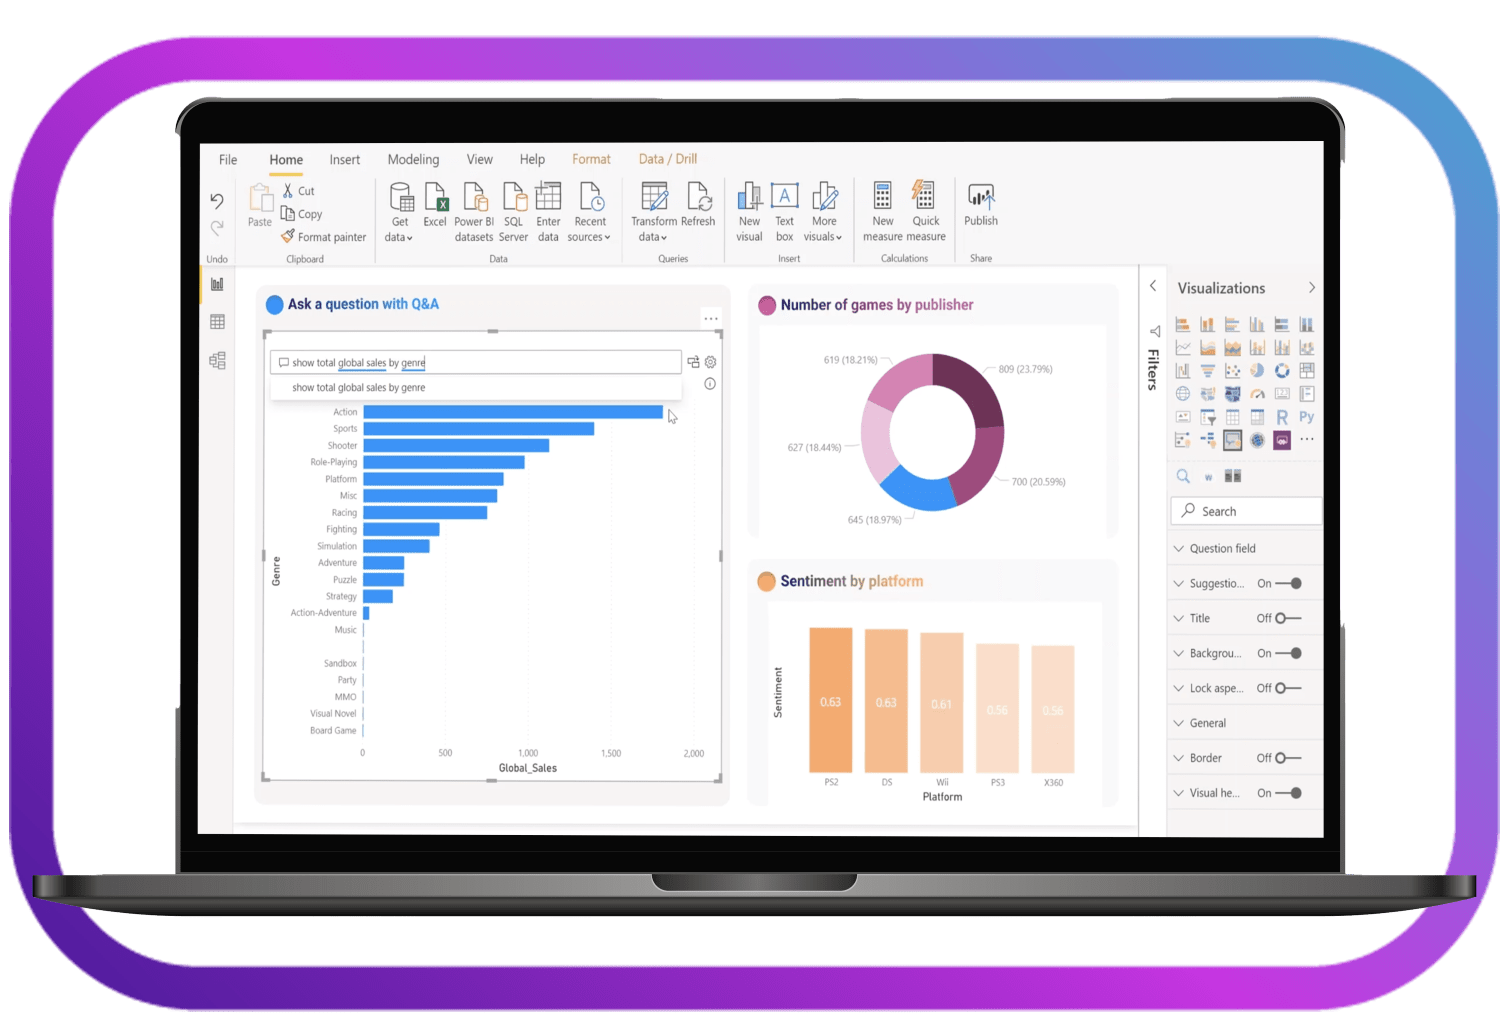
Advanced analysis
Power BI offers advanced analysis capabilities such as predictive analytics, data mining and artificial intelligence. These functions allow you to discover trends, patterns and relationships hidden in the data to gain deeper insights and guide data-driven decisions
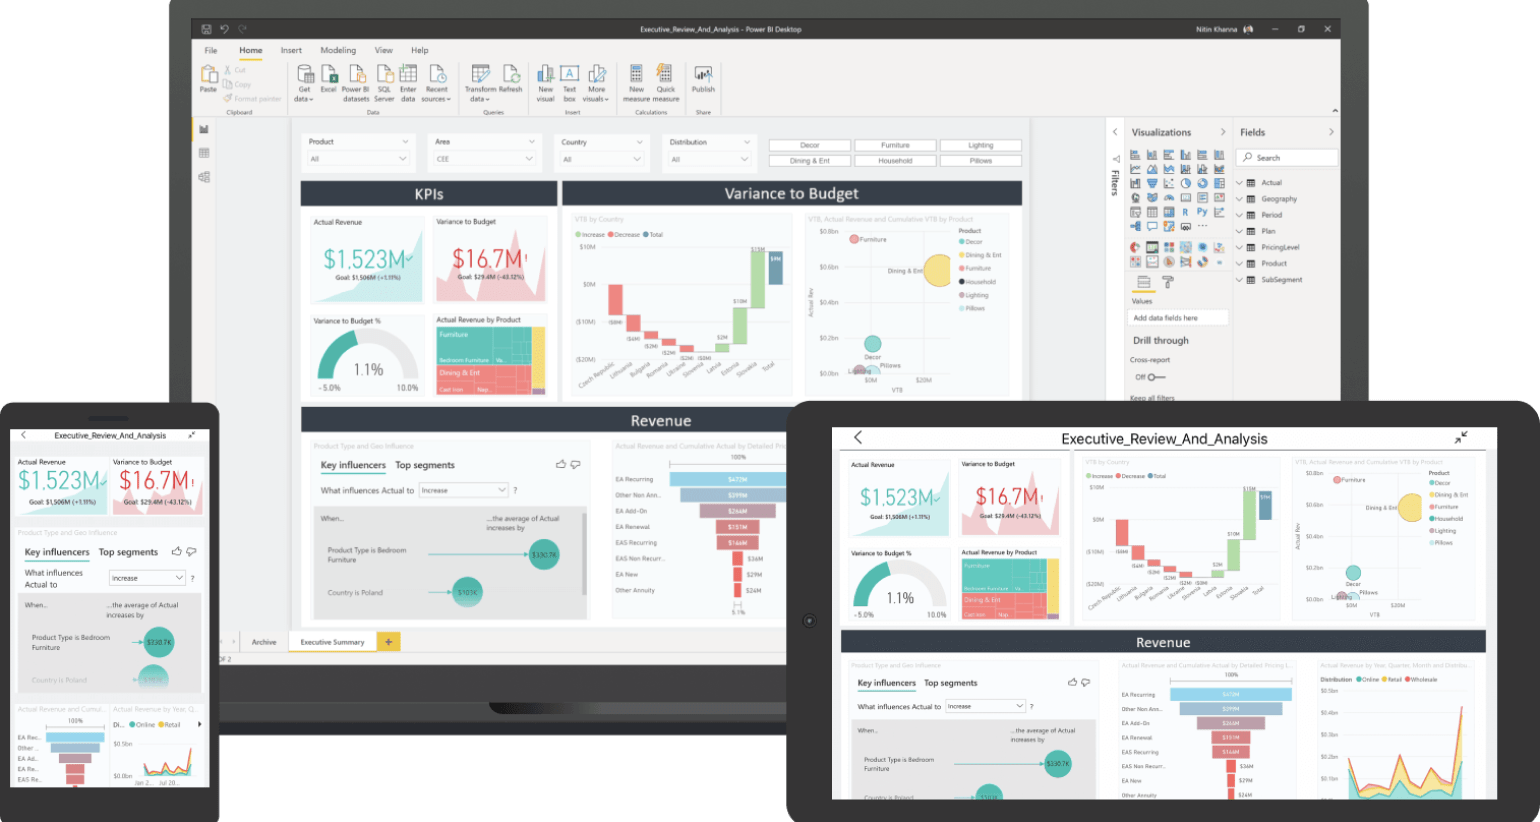
Creation of interactive reports
With Power BI, you can create interactive and customised reports using a wide range of visualisations, such as graphs, tables, maps and more. You can dynamically explore and analyse data, apply filters and interact with reports to gain insight.
Sharing and collaboration
It is possible to share reports and dashboards with other people within the organisation according to their role
Dashboard
Power BI allows you to create interactive dashboards that provide a visual overview of your most important data. Data visualisations can be organised into a single customised dashboard and shared with other users for easy visualisation and collaboration.